
Analytics
The overview, the analytics page and team analytics — what the numbers mean and where they come from.
Do this on my dashboardAll figures come from archived tickets and the open queue, so they need Archive transcripts in the database on (Ticket setup → Logging). Some fields — who closed a ticket, whether it was opened out of hours — are recorded from the day they were introduced, so older tickets show as not recorded.
Overview
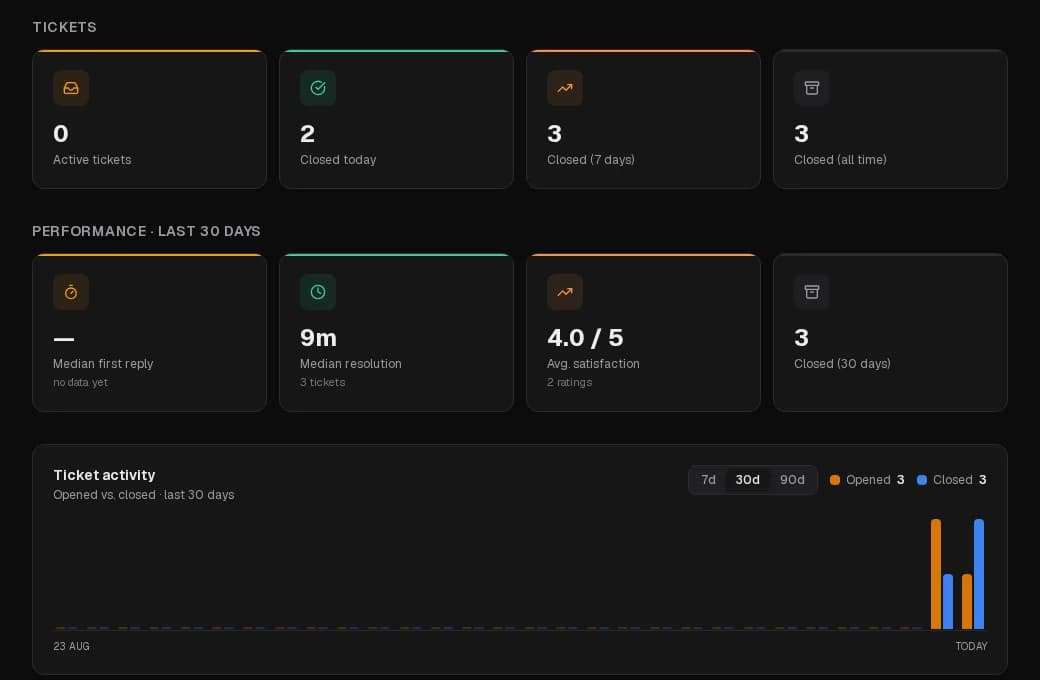
The server's front page. Tickets: active, closed today, closed in 7 days, closed all time. Performance · last 30 days: median first reply, median resolution, average satisfaction, closed in 30 days. A chart of opened vs closed tickets over the last weeks, the recent activity feed, and the configuration checklist. Stats refresh on each page load.
Analytics
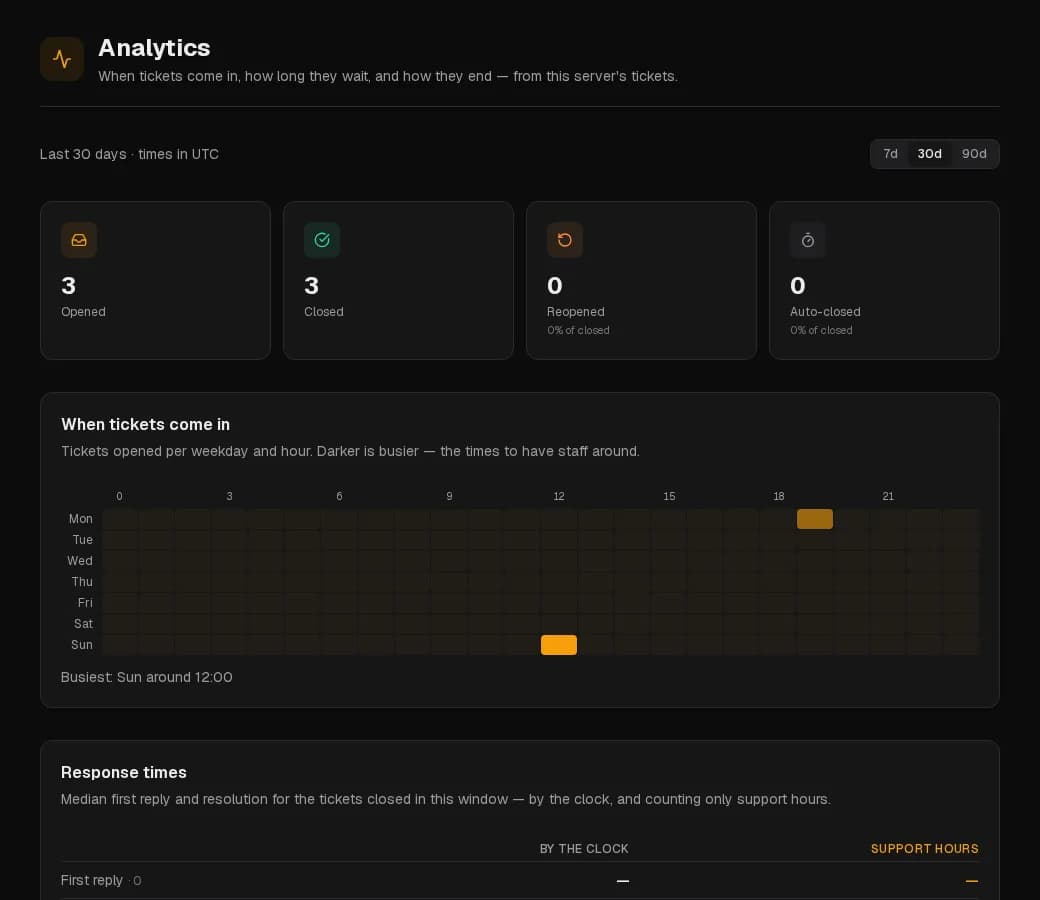
Sidebar → Tickets → Analytics. Everything is over a window, with times shown in the server's timezone.
| Card | What it shows |
|---|---|
| When tickets come in | A weekday × hour heatmap of tickets opened. Darker is busier — the times to have staff around. |
| Satisfaction | How closed tickets were rated, from the 1–5 star prompt. |
| Priority mix | What the team flagged as high or urgent, now and over the window. |
| Backlog age | How long the currently open tickets have been open, in buckets, and how many are waiting for a staff reply. |
| How tickets end | Closed by staff, by the member, auto-closed, or not recorded. |
| Response times | Median first reply and resolution for tickets closed in the window. With support hours on, also counted in support hours only, and how many tickets were opened out of hours. |
| Verification | Members who joined in the last 30 days and went through verification: verified, pass rate, median time, removed, still waiting, possible alts, by method. |
| Member growth | One point a day from server stats: members and boosts, net change, peak. 7 days on the free plan, 30 with Premium. |
Team analytics
Sidebar → Tickets → Team Analytics. How the support team is performing over the window, from closed tickets:
- Active agents, tickets resolved, staff replies, team median first reply.
- The agent leaderboard, ranked by tickets handled — a handled ticket is one the agent replied to at least once — with replies, tickets they answered first, median first reply, tickets they closed, and their average rating.
Agents are identified by the name shown on their ticket replies.
Premium